Page 2 of 3
Re: Probabilistic Graphical Models, Fall 2016

Posted:
Thu Oct 13, 2016 4:59 pmby lsand039
Age distributions:
301 total subjects, 34 AD samples, 2267 control samples under 65.
735 total subjects 514 AD samples, 221 control samples 74.5 years or older.
211 total subjects,132 AD samples, 79 control samples over 90.
Re: Probabilistic Graphical Models, Fall 2016
Posted:
Fri Oct 14, 2016 12:06 amby lsand039
Attached is my proposal with a couple revisions.
Re: Probabilistic Graphical Models, Fall 2016
Posted:
Fri Oct 14, 2016 12:48 pmby lsand039
Here I had to redo the descritization on GSE44768, 44770, and 44771 so all the brain regions can be accounted for in the z-score.
Re: Probabilistic Graphical Models, Fall 2016
Posted:
Sun Oct 16, 2016 11:02 pmby igrif005
I added a few edits to my draft. I added viral load to the model and changed the labels to reflect the actual dataset. I plan to continue to add to this proposal for the final paper. This will include an extensive literature review justifying each node in the network model.
Re: Probabilistic Graphical Models, Fall 2016
Posted:
Tue Oct 18, 2016 9:09 amby lsand039
Here are the Bene results for my data. I split my data into 4 groups after randomizing the samples. Group 1 & 2 both have 318 samples while group 3 & 4 have 317 samples. All the resulting structures were the same.
Re: Probabilistic Graphical Models, Fall 2016
Posted:
Thu Oct 27, 2016 9:27 pmby cwyoo
As we discussed in class, I ask we discuss whether the following two structures (a) and (b) are equivalent or not.
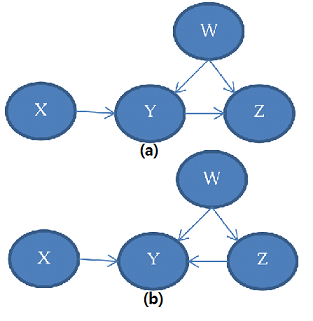
- causal_structures.png (67.64 KiB) Viewed 4581 times
Re: Probabilistic Graphical Models, Fall 2016
Posted:
Mon Nov 07, 2016 9:26 amby lsand039
Below are the results of group 4, my test data. When figuring out which arc was the best to remove, there were 4 times where the best graph was not at least 95% (highlighted in yellow). Removing any more arcs in the final structure would remove Brain Region.
I'm still working on the test datasets (groups 1-3).
Re: Probabilistic Graphical Models, Fall 2016
Posted:
Wed Nov 09, 2016 11:07 amby lsand039
As for the discussion, in (a), given no evidence x and z are d-connected through a serial relationship {x,y,z}. In (b), x and z are d-separated since they converge/ collide at y. They cannot be d-connected through {x, y, w, z} since x and w converge/ collide at y as well. I think this is why (a) and (b) are not equivalent.
Re: Probabilistic Graphical Models, Fall 2016
Posted:
Wed Nov 16, 2016 11:38 amby lsand039
The structure from my training group & scores/ percentages.
Re: Probabilistic Graphical Models, Fall 2016
Posted:
Fri Dec 02, 2016 12:15 amby igrif005
Dr. Yoo, Here is my new DAG.